
MTF Curves Explained: How to Read & Choose a Lens
When choosing a camera lens, you may come across an MTF curve on a manufacturer’s website, product page, or lens specification sheet. At first glance, an MTF chart can look complicated, with multiple lines, numbers, and graphs that may be difficult to understand.
However, learning the basics of MTF can make it easier to understand how a lens is designed to reproduce contrast and fine detail.
MTF stands for Modulation Transfer Function. In simple terms, it is a numerical representation of how faithfully a lens can transmit image information to the camera sensor. MTF curves are commonly used as reference data for evaluating aspects of a lens’s contrast reproduction and resolution performance.
An MTF chart cannot tell you everything about how a lens will look in real-world photography. Factors such as bokeh, color rendering, gradation, flare behavior, autofocus performance, size, and handling also influence the overall shooting experience.
In this guide, we’ll explain what MTF is, how to read an MTF curve, what the different line frequencies indicate, and how to use MTF charts when choosing a camera lens.
What Is MTF?
MTF stands for Modulation Transfer Function.
It describes how effectively a lens transfers variations in brightness and detail from the subject through the optical system to the camera sensor.
A lens does not simply reproduce an image as either “sharp” or “unsharp.” Its ability to reproduce contrast can vary depending on the size of the details being recorded and where those details appear within the image.
An MTF chart provides a graphical way of examining this performance.
Typically, the graph uses:
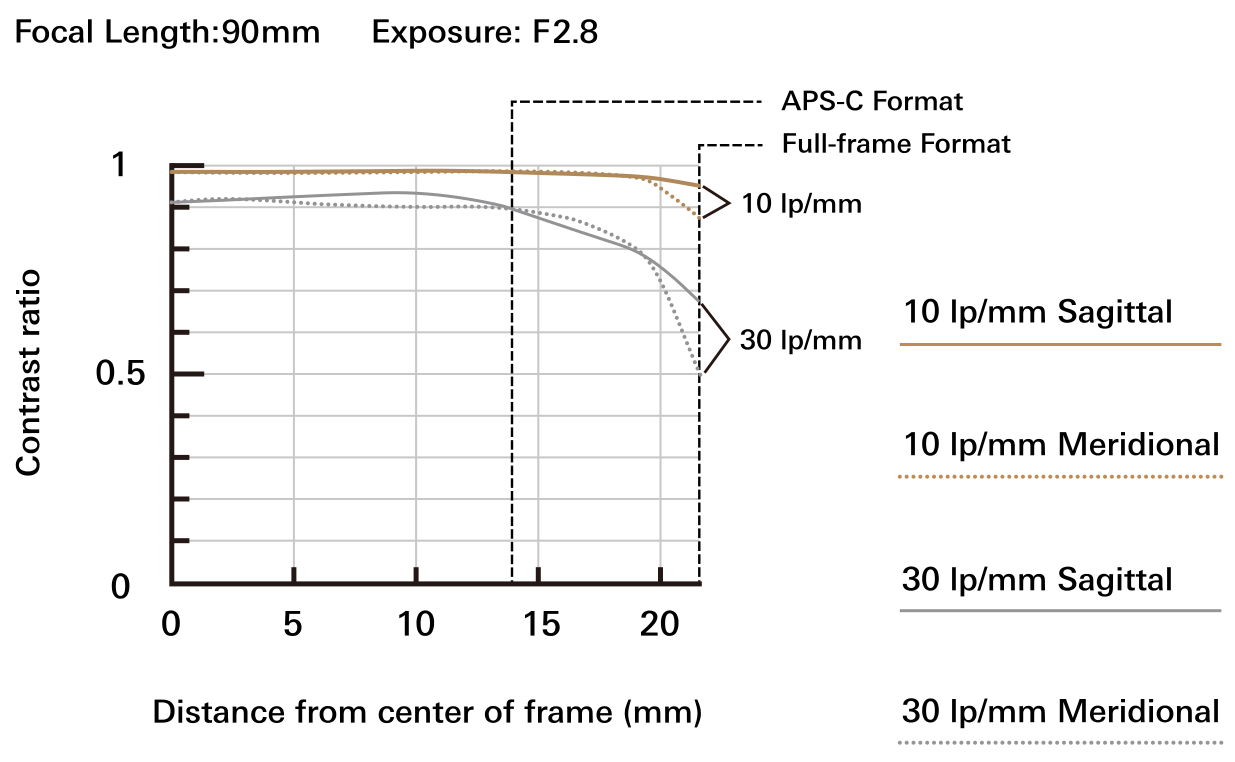
- The horizontal axis (X-axis) to represent image height, or distance from the center of the image
- The vertical axis (Y-axis) to represent MTF or contrast reproduction
The closer a curve remains to the top of the graph, the stronger the measured performance represented by that curve.
This makes the MTF chart useful for examining how a lens performs from the center toward the edges of the frame.
What Does an MTF Curve Tell You?
An MTF curve primarily provides information about two important aspects of optical performance:
- Contrast reproduction
- Resolution or fine-detail reproduction
TAMRON’s published MTF curves use two spatial frequencies: 10 lines/mm and 30 lines/mm. These provide different information about how the lens reproduces image detail.
Understanding the difference between these two frequencies is one of the most important parts of reading an MTF chart.
Understanding 10 Lines/mm
The 10 lines/mm measurement is associated primarily with the reproduction of relatively larger image structures and overall contrast.
When the 10 lines/mm curve remains high, it indicates strong contrast reproduction.
In practical terms, this can contribute to an image appearing:
- Clear
- Well-defined
- High in contrast
- Visually crisp
A 10 lines/mm curve that remains close to 1, particularly across a large portion of the image, indicates strong contrast reproduction according to the MTF measurement.
This does not mean that the photograph will automatically look better in every situation, but it provides useful information about one aspect of the lens’s optical performance.
Understanding 30 Lines/mm
The 30 lines/mm measurement represents finer details.
A high 30 lines/mm curve indicates that the lens is capable of maintaining strong reproduction of finer image details.
This is associated with what photographers often perceive as:
- Fine detail
- High resolution
- Sharp rendering
- Clear textures
A lens with strong performance at 30 lines/mm can be particularly interesting when fine detail and resolution are important.
For example, this can matter when photographing:
- Landscapes
- Architecture
- Product details
- Fine textures
- Macro subjects
- High-resolution subjects
TAMRON explains that a 30 lines/mm curve closer to the maximum value indicates stronger high-resolution performance.
Why Are Both 10 and 30 Lines/mm Important?
Looking at only one MTF curve does not provide the complete picture.
A lens can have strong contrast reproduction but different levels of fine-detail reproduction, or vice versa.
That is why looking at both 10 lines/mm and 30 lines/mm can provide a broader understanding of optical performance.
In general:
- 10 lines/mm: useful for understanding contrast reproduction
- 30 lines/mm: useful for understanding fine-detail and resolution reproduction
When both measurements remain relatively high, the lens demonstrates strong performance in both areas according to the MTF data.
Understanding the Horizontal Axis
The horizontal axis of an MTF chart represents image height, or the distance from the center of the image.
The center of the frame is normally represented at the beginning of the horizontal axis.
As you move farther along the axis, you are examining areas progressively closer to the edge of the image.
This is important because a lens may perform differently at the center and toward the edges.
For example, an MTF curve might remain relatively high near the center but decrease toward the edge.
This means that the lens’s measured performance changes as you move away from the center of the frame.
When looking at an MTF chart, therefore, don’t only look at where the curves begin. Pay attention to how they behave across the entire image height.
Center vs. Edge Performance
The center of an image is generally easier for an optical system to reproduce at a high level than the extreme edges.
This is why MTF curves can be useful for understanding how consistently a lens maintains its measured performance across the frame.
A curve that stays relatively high from the center toward the edges indicates stronger consistency in the characteristic being measured.
On the other hand, a curve that decreases significantly toward the edge indicates that performance changes more noticeably as you move away from the center.
This can be particularly relevant when choosing a lens for subjects where edge detail matters, such as:
- Landscapes
- Architecture
- Reproduction work
- Product photography
- Documents
- High-detail scenes
However, the importance of edge performance depends on how you actually use the lens.
For portraits, for example, the center and subject area may be more important than extreme corner performance.
What Are Sagittal and Meridional Lines?
When examining detailed MTF charts, you may also encounter terms such as Sagittal and Meridional.
These refer to different orientations of the test patterns used to evaluate the optical system.
TAMRON’s MTF charts commonly distinguish between 10 lines/mm Sagittal, 10 lines/mm Meridional, 30 lines/mm Sagittal, and 30 lines/mm Meridional.
For a beginner, the most important point is not to become overwhelmed by these labels.
Instead, think of them as measurements taken in different orientations across the image.
The relationship between the Sagittal and Meridional curves can provide additional information about how consistently the lens reproduces detail.
When these curves remain relatively close together, the lens demonstrates more consistent behavior between the measured orientations.
When they separate significantly, it can indicate differences in optical behavior that may relate to characteristics such as astigmatism or other aberrations.
This is one reason an MTF chart contains multiple curves rather than a single line.
Why Do MTF Curves Change Across the Frame?
Lens performance can change from the center of the image toward the edges because of the complex nature of optical design.
A lens contains multiple optical elements that work together to focus light onto the sensor.
Different types of optical aberrations can affect how accurately light is focused, particularly toward the edges of the frame.
As a result, an MTF curve may gradually decrease as image height increases.
This doesn’t automatically mean the lens is poor.
The amount and pattern of change need to be considered in the context of the lens’s design, focal length, aperture, and intended use.
MTF Curves and Zoom Lenses
Zoom lenses introduce another consideration because optical performance can change at different focal lengths.
A zoom lens may have separate MTF charts for different positions within its zoom range.
For example, a standard zoom may provide MTF measurements at its wide-angle and telephoto ends.
This allows you to see how the lens performs at different focal lengths.
When evaluating a zoom lens, look at the MTF information for the focal lengths that you are most likely to use.
A lens designed for versatility may have slightly different optical characteristics at different points throughout its zoom range.
MTF Curves and Aperture
MTF charts are also associated with a particular aperture.
The aperture used for the measurement matters because optical performance can change when the lens is stopped down.
Some lens specifications therefore identify the aperture used for the MTF measurement.
When comparing two MTF charts, make sure you understand the conditions under which the measurements were made.
A comparison is most useful when the lenses are being evaluated under comparable conditions, such as similar focal lengths and apertures.
How to Use an MTF Chart When Choosing a Lens
An MTF chart can be particularly useful when you already have several lenses under consideration.
Instead of treating the chart as a simple score, use it as one source of technical information.
1. Compare Similar Lenses
MTF curves are most useful when comparing lenses with similar specifications.
For example, if you’re choosing between several standard zoom lenses with similar focal-length ranges and maximum apertures, their MTF charts can provide additional information about differences in measured contrast and resolution.
TAMRON specifically recommends using MTF curves as a reference when comparing lenses with similar focal lengths and F-numbers from the same manufacturer.
2. Check Center Performance
Start by examining where the curves begin.
A high value near the center indicates strong measured performance in that area.
This can provide a useful indication of the lens’s central contrast and resolution characteristics.
3. Follow the Curves Toward the Edge
Don’t stop at the center.
Follow each curve toward the edge of the frame.
Ask yourself:
- Does the curve remain high?
- Does it gradually decline?
- Does it decline significantly?
- Do the different curves remain close together?
- Is performance relatively consistent across the image?
This can help you understand how the lens behaves across the frame.
4. Look at Both 10 and 30 Lines/mm
Remember that the two frequencies provide different information.
A lens with strong 10 lines/mm performance can demonstrate strong contrast reproduction.
A strong 30 lines/mm result indicates stronger reproduction of fine detail.
Looking at both gives you a more complete picture of the measured optical characteristics.
5. Consider Your Photography Style
Technical measurements are only useful when they relate to how you actually photograph.
For example, a landscape photographer who frequently needs detailed corners may pay more attention to edge performance.
A portrait photographer may be more interested in other characteristics, including rendering, bokeh, and how the lens handles skin tones and background transitions.
A macro photographer may place greater importance on fine detail, focusing behavior, and close-range performance.
Your ideal lens therefore depends not only on technical performance but also on the type of images you want to create.
Why You Shouldn’t Choose a Lens Based Only on MTF
This is one of the most important points to remember.
MTF is a reference—not a complete description of a lens.
A lens’s actual photographic performance includes characteristics that an MTF chart cannot fully describe.
For example, MTF cannot tell you everything about:
- Bokeh quality
- Bokeh shape and texture
- Color rendering
- Tonal gradation
- Flare resistance
- Ghosting
- Autofocus behavior
- Minimum focusing performance
- Handling
- Size and weight
- Video performance
TAMRON specifically notes that characteristics such as bokeh texture, gradation, and color bleeding in backlit situations cannot be determined from the MTF curve alone.
The published MTF values are also theoretical measurements and may differ from what you experience under actual shooting conditions.
This is why sample photographs and hands-on reviews remain important.
Look at Sample Photos Alongside MTF
After examining the MTF chart, look at actual photographs taken with the lens.
Sample images can help you evaluate characteristics that a graph cannot communicate.
Pay attention to:
Sharpness
Look closely at fine textures and details.
Are they rendered with the level of clarity you expect?
Bokeh
If you shoot portraits or subjects with a shallow depth of field, examine how out-of-focus areas appear.
Look for the shape, smoothness, and overall character of the background blur.
Contrast
Look at the transition between light and dark areas.
A lens’s rendering of contrast contributes to the overall visual character of an image.
Gradation
Examine areas with subtle transitions, such as skies, skin tones, or shadows.
Gradation is particularly important for photographs where smooth tonal transitions contribute to the image’s atmosphere.
Backlighting
Look at sample photographs taken toward a strong light source.
This can provide information about flare, ghosting, and contrast loss that cannot be determined from an MTF curve alone.
MTF and Different Types of Photography
The usefulness of MTF information depends partly on what you photograph.
Landscape Photography
For landscapes, resolution and edge performance can be particularly useful because the entire frame may contain important detail.
MTF can provide a useful technical reference, but also examine actual landscape samples for corner detail, contrast, color, and gradation.
Portrait Photography
Portrait photographers may be interested in resolution, but MTF is only part of the equation.
Bokeh, rendering, autofocus, maximum aperture, and the way the lens handles skin tones can also have a major effect on the final photograph.
Macro Photography
Macro photography often benefits from strong fine-detail reproduction.
The 30 lines/mm information can therefore be interesting when evaluating lenses designed for close-up work.
However, focusing accuracy, minimum object distance, working distance, and bokeh are also important.
Travel Photography
For travel photography, optical performance is only one consideration.
A compact lens with a useful zoom range may be more practical than a larger lens with different optical characteristics.
Weight, size, autofocus, versatility, and image stabilization can all influence how often you actually use the lens.
A Simple Way to Read an MTF Chart
If you’re new to MTF charts, you don’t need to understand every technical detail immediately.
Start with these five steps:
Step 1: Check the axes.
The horizontal axis shows distance from the image center, while the vertical axis shows MTF.
Step 2: Identify the frequencies.
Look for the 10 lines/mm and 30 lines/mm curves.
Step 3: Look at the height of the curves.
Higher values generally indicate stronger measured contrast or resolution at that point.
Step 4: Follow the curves toward the edges.
See how consistently the lens maintains its measured performance across the frame.
Step 5: Compare the chart with real photographs.
Use sample images and reviews to evaluate characteristics that MTF cannot show.
This approach gives you useful technical information without turning lens selection into a purely numerical exercise.
MTF Is a Tool, Not a Score
It can be tempting to look at an MTF chart and search for the lens with the highest curves.
However, this approach can oversimplify lens selection.
Photography is not only about resolution.
Two lenses with strong MTF performance can still produce photographs with different visual characteristics.
One may have smoother bokeh. Another may have different contrast or color rendering. One may be smaller and easier to carry. Another may provide faster autofocus or better stabilization.
The right lens depends on the combination of characteristics that matter to you.
TAMRON recommends considering MTF alongside actual sample photographs, usage reviews, and—most importantly—the type of image rendering and atmosphere you want to achieve.
Final Thoughts
MTF curves may look intimidating at first, but the basic concept is relatively straightforward.
They provide technical information about how a lens reproduces contrast and fine detail, and how those characteristics change from the center of the image toward the edges.
Remember the key points:
- 10 lines/mm provides a reference for contrast reproduction.
- 30 lines/mm provides a reference for finer detail and resolution.
- The horizontal axis represents distance from the center of the image.
- Higher curves generally indicate stronger measured performance.
- Differences between Sagittal and Meridional curves provide additional information about optical behavior.
- Zoom lenses may have different MTF characteristics at different focal lengths.
- MTF charts should be compared under similar conditions.
- MTF is a theoretical reference and does not describe every aspect of real-world lens performance.
- Sample photographs and hands-on reviews remain important when choosing a lens.
Once you understand these basics, an MTF chart becomes much less intimidating. Instead of simply looking at a complicated graph, you can use it as one useful source of information when comparing lenses and deciding which optical characteristics best match your photography.
Ultimately, the best lens is not necessarily the one with the most impressive-looking graph. It is the lens whose optical characteristics, handling, features, and rendering fit the photographs you want to create.
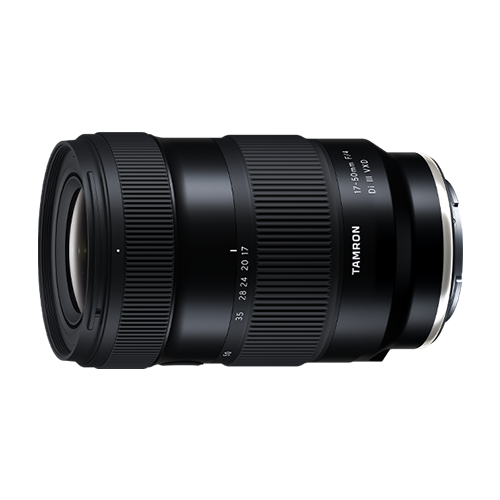
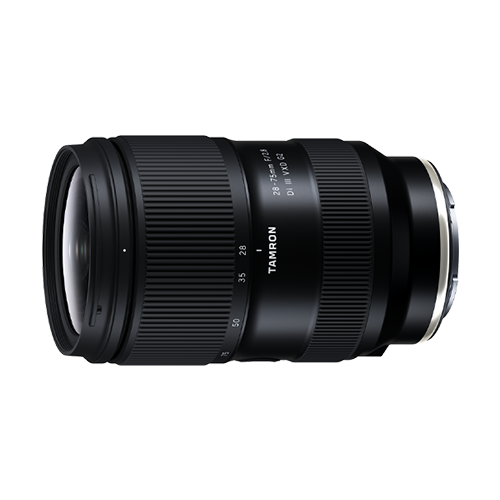
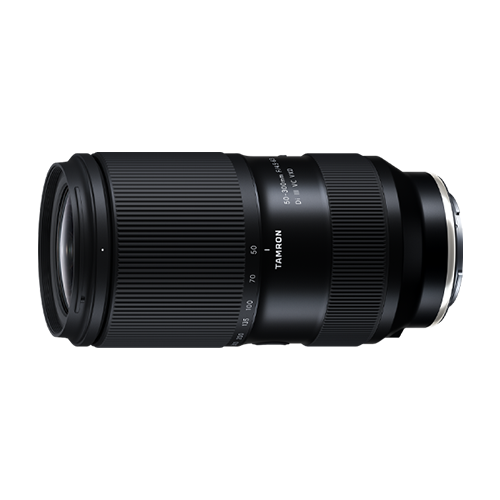
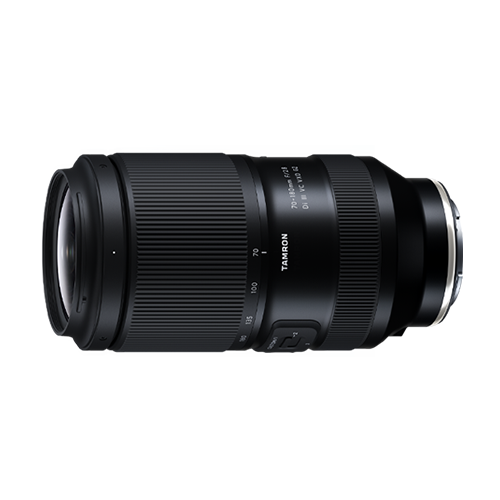
TAMRON products mentioned in this article